Web Performance Metrics That Actually Matter in 2025
The web performance landscape underwent a seismic shift in March 2024 when Google officially replaced First Input Delay (FID) with Interaction to Next Paint (INP) as a Core Web Vital. This change affected nearly 600,000 websites, marking the most significant update to performance measurement since Core Web Vitals launched in 2020.
But here's what many miss: while Core Web Vitals grab the headlines, the metrics that truly drive business success extend far beyond Google's triumvirate. From conversion rates to user engagement, the performance metrics that matter most are those that directly impact your bottom line.
This comprehensive guide explores the essential metrics you need to track in 2024-2025, backed by real-world data from over 1.3 billion sessions and case studies showing how performance optimization drives measurable business results.
The Great INP Transition: What Changed and Why It Matters
Understanding the Shift from FID to INP
In March 2024, Interaction to Next Paint (INP) officially replaced First Input Delay (FID) as a Core Web Vital metric. This wasn't just a minor adjustment - it fundamentally changed how we measure page responsiveness.
Key Differences:
- FID: Measured only the delay of the first user interaction
- INP: Measures responsiveness across all interactions throughout a user's entire session
Only 65% of sites have good INP on mobile devices compared to 93% that had good FID performance, revealing that the new metric paints a much more accurate picture of user experience.
INP Measurement Breakdown
INP consists of three critical components:
Total INP = Input Delay + Processing Time + Presentation Delay
- Input Delay: Time between user interaction and browser event processing
- Processing Time: Time for browser to execute event handlers
- Presentation Delay: Time to recalculate layout and paint pixels
Current Thresholds:
- Good: ≤ 200 milliseconds
- Needs Improvement: 200-500 milliseconds
- Poor: > 500 milliseconds
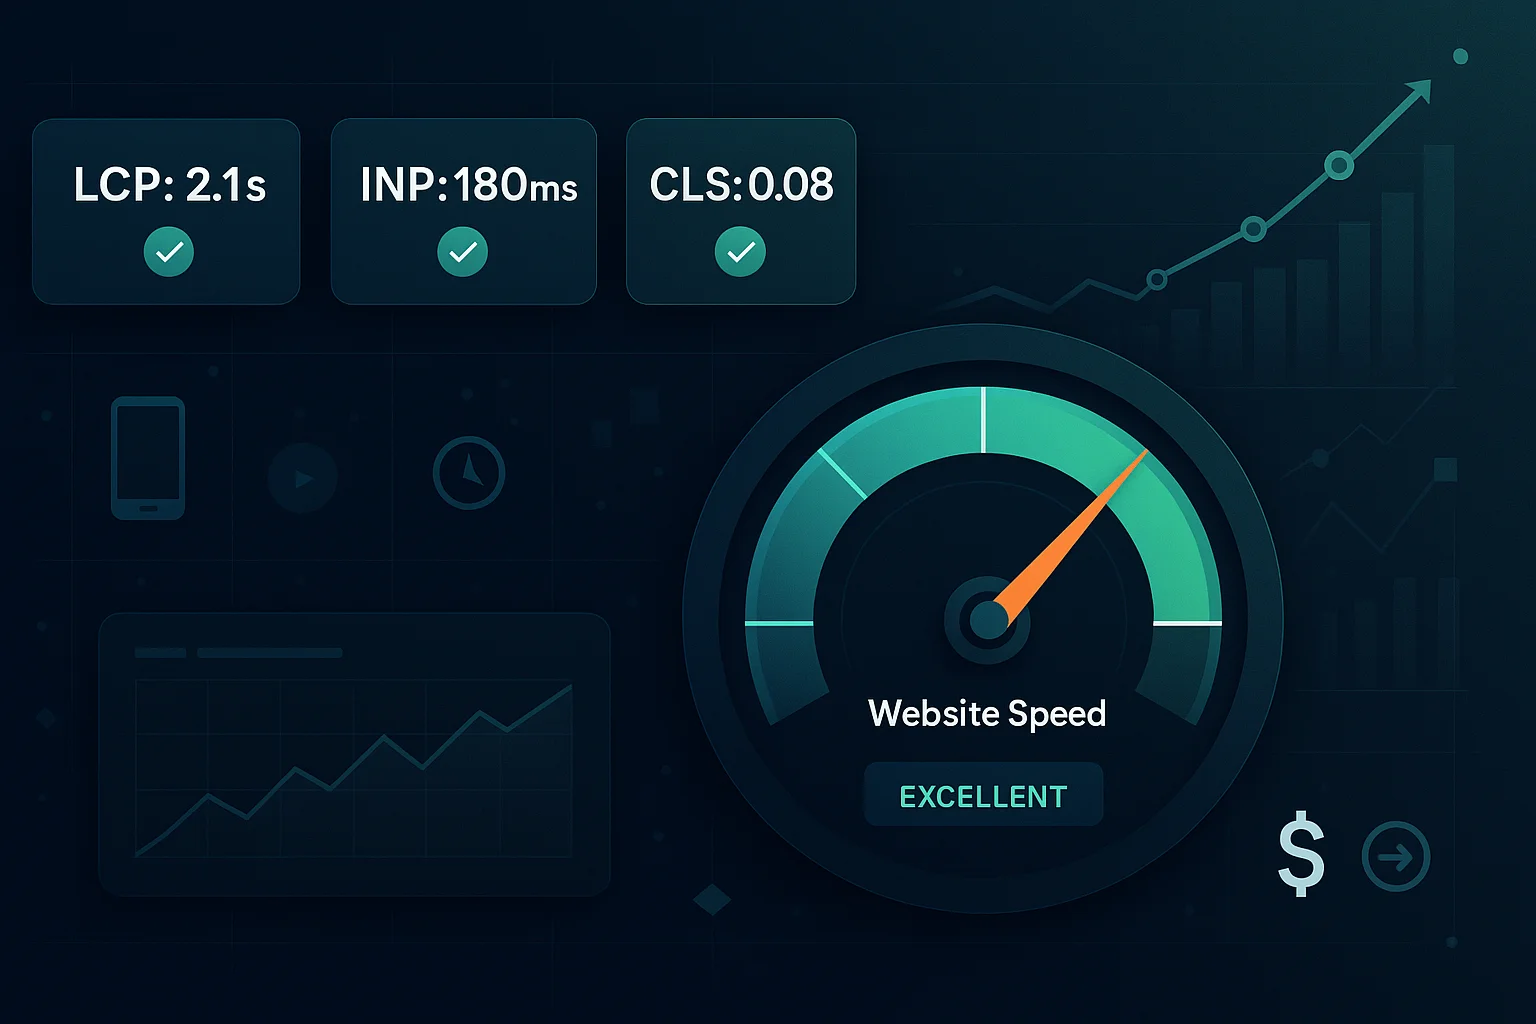
Core Web Vitals 2025: The Essential Trinity
1. Largest Contentful Paint (LCP) - Loading Performance
LCP measures how long it takes for the largest content element to load and become visible to users. As of 2024, only 57.8% of sites achieve good LCP scores, making it the most challenging Core Web Vital to optimize.
Thresholds:
- Good: ≤ 2.5 seconds
- Needs Improvement: 2.5-4.0 seconds
- Poor: > 4.0 seconds
What Counts as LCP:
- Large images or image blocks
- Video poster images
- Block-level text elements
- Background images loaded via CSS
Business Impact Example: Groupe Renault found that a 1-second LCP improvement led to a 14 percentage point decrease in bounce rate and a 13% increase in conversions.
2. Interaction to Next Paint (INP) - Responsiveness
INP measures how quickly your page responds to user interactions throughout the entire session, not just the first click.
Critical for Business Because:
- Directly impacts user frustration levels
- Affects perceived site quality
- Influences conversion completion rates
Optimization Strategies:
JavaScript// Use React's useTransition for non-blocking updates import { useTransition } from 'react' function SearchComponent() { const [isPending, startTransition] = useTransition() const handleSearch = (query) => { startTransition(() => { // Heavy search operation won't block UI performSearch(query) }) } }
3. Cumulative Layout Shift (CLS) - Visual Stability
CLS measures unexpected layout shifts that occur during page loading. Yahoo! JAPAN saw 15.1% more page views per session and 13.3% longer session duration after optimizing CLS.
Thresholds:
- Good: ≤ 0.1
- Needs Improvement: 0.1-0.25
- Poor: > 0.25
Common Causes:
- Images without dimensions
- Dynamic content insertion
- Web fonts causing text reflow
- Ads and embeds without reserved space
Beyond Core Web Vitals: The Complete Performance Picture
Time to First Byte (TTFB) - Foundation Metric
TTFB should be 0.8 seconds or less, with poor values being greater than 1.8 seconds. While not a Core Web Vital, TTFB significantly impacts all loading metrics.
Why TTFB Matters:
- Foundation for all other metrics
- Server response quality indicator
- Critical for dynamic applications
Optimization Tactics:
- Use CDNs for global distribution
- Implement efficient caching strategies
- Optimize server-side rendering
- Use HTTP/2 and HTTP/3
First Contentful Paint (FCP) - Initial Loading Perception
Sites should strive for FCP of 1.8 seconds or less to provide good user experience.
FCP measures when any content first appears on screen, giving users confidence that the page is loading.
Total Blocking Time (TBT) - JavaScript Performance
TBT measures the time between FCP and Time to Interactive when the main thread was blocked. Critical for understanding JavaScript impact on interactivity.
Business-Critical Metrics That Drive Revenue
Bounce Rate: The Engagement Indicator
The median bounce rate across all industries is approximately 45.9% as of 2024, but this varies significantly by industry:
Industry Benchmarks:
- Real Estate: ~40.8%
- Apparel & Footwear: ~50% (14% below median)
- Travel: ~82.6%
- Construction: ~67.24%
Performance Connection: Google's research shows that as load times go from 1s to 3s, the probability of bounce increases by 32%.
Conversion Rate: The Bottom Line Metric
The average conversion rate across all industries is 3.3%, with e-commerce averaging 2.5-3%.
Performance Impact on Conversions: For every 100ms of improved checkout load speed, retailers saw 1.55% more conversions on average.
Industry Conversion Benchmarks:
- Overall average: 3.3%
- E-commerce: 2.5-3%
- Lead generation forms: ~33% completion rate
Revenue Attribution and Performance
The ultimate metric is revenue impact. Here's how performance directly affects your bottom line:
Case Study Highlights:
- Tokopedia saw a 42% increase in mobile revenue after improving Core Web Vitals
- Financial Times experienced a 4.6% drop in article views for every 1-second delay
- NDTV achieved a 50% bounce rate reduction with 55% LCP improvement
Measuring What Matters: Tools and Implementation
Primary Measurement Tools
Field Data (Real User Monitoring):
- Google Search Console Core Web Vitals Report
- Chrome User Experience Report (CrUX)
- PageSpeed Insights field data
- Real User Monitoring (RUM) solutions
Lab Data (Synthetic Testing):
- Lighthouse performance audits
- WebPageTest
- Chrome DevTools Performance tab
Implementation Code Examples
Measuring Core Web Vitals:
JavaScriptimport { onCLS, onFCP, onFID, onLCP, onTTFB } from 'web-vitals' // Track all vital metrics onCLS(console.log) onFCP(console.log) onLCP(console.log) onTTFB(console.log) // Send to analytics function sendToAnalytics(metric) { gtag('event', metric.name, { value: Math.round(metric.value), event_category: 'Web Vitals', non_interaction: true, }) } onCLS(sendToAnalytics) onLCP(sendToAnalytics)
Performance Observer API:
JavaScript// Monitor long tasks that impact INP const observer = new PerformanceObserver((entryList) => { for (const entry of entryList.getEntries()) { if (entry.duration > 50) { console.warn('Long task detected:', entry.duration) } } }) observer.observe({ entryTypes: ['longtask'] })
Industry-Specific Performance Considerations
E-commerce Platforms
Critical Metrics:
- Product page LCP (affects purchase intent)
- Checkout process INP (impacts conversion completion)
- Search functionality responsiveness
Optimization Priorities:
- Image optimization for product galleries
- Lazy loading for product recommendations
- Progressive enhancement for checkout flows
Media and Publishing
Key Focus Areas:
- Article LCP for content consumption
- Ad loading impact on CLS
- Infinite scroll performance
SaaS and B2B Applications
Performance Priorities:
- Dashboard loading times
- Form submission responsiveness
- Data table rendering performance
Setting Performance Budgets and Goals
Establishing Baselines
Step 1: Current State Assessment
JavaScript// Performance budget monitoring const performanceBudget = { lcp: 2500, // 2.5 seconds inp: 200, // 200 milliseconds cls: 0.1, // 0.1 score ttfb: 800, // 800 milliseconds bundleSize: 300 // 300KB } function checkBudget(metrics) { const violations = [] if (metrics.lcp > performanceBudget.lcp) { violations.push(`LCP exceeded: ${metrics.lcp}ms`) } return violations }
Step 2: Industry Benchmarking
- Compare against industry averages
- Set goals 20% better than current performance
- Establish monitoring and alerting thresholds
Performance Goals Framework
Tier 1 Goals (Critical):
- All Core Web Vitals in "Good" range
- Bounce rate below industry average
- Page load time under 3 seconds
Tier 2 Goals (Optimal):
- 75th percentile performance better than competitors
- Conversion rate above industry benchmark
- Zero accessibility violations
Tier 3 Goals (Aspirational):
- Top 10% performance in your industry
- Sub-second perceived load times
- 90th percentile user satisfaction scores
Advanced Performance Optimization Strategies
Progressive Loading Techniques
JavaScript// Intersection Observer for lazy loading const imageObserver = new IntersectionObserver((entries, observer) => { entries.forEach(entry => { if (entry.isIntersecting) { const img = entry.target img.src = img.dataset.src img.classList.remove('lazy') observer.unobserve(img) } }) }) document.querySelectorAll('img[data-src]').forEach(img => { imageObserver.observe(img) })
Resource Prioritization
HTML<!-- Critical resource hints --> <link rel="preload" href="/critical.css" as="style"> <link rel="preload" href="/hero-image.webp" as="image"> <link rel="dns-prefetch" href="//fonts.googleapis.com"> <link rel="preconnect" href="//analytics.google.com">
Service Worker Optimization
JavaScript// Cache-first strategy for static assets self.addEventListener('fetch', event => { if (event.request.destination === 'image') { event.respondWith( caches.match(event.request).then(response => { return response || fetch(event.request).then(fetchResponse => { const responseClone = fetchResponse.clone() caches.open('images').then(cache => { cache.put(event.request, responseClone) }) return fetchResponse }) }) ) } })
Mobile Performance Considerations
Mobile devices account for 61% of global traffic, making mobile optimization critical for success.
Mobile-Specific Challenges
Network Constraints:
- Slower connection speeds
- Higher latency
- Data usage concerns
Device Limitations:
- Less processing power
- Smaller viewport
- Touch interactions
Optimization Strategies:
- Implement adaptive serving
- Use responsive images with
srcset - Prioritize critical rendering path
- Minimize JavaScript execution
Performance Monitoring and Alerting
Continuous Monitoring Setup
Real User Monitoring Dashboard:
JavaScript// Custom performance tracking class PerformanceTracker { constructor() { this.metrics = {} this.setup() } setup() { // Track navigation timing window.addEventListener('load', () => { const navigation = performance.getEntriesByType('navigation')[0] this.metrics.loadTime = navigation.loadEventEnd - navigation.navigationStart this.sendMetrics() }) } sendMetrics() { // Send to your analytics platform fetch('/api/performance', { method: 'POST', body: JSON.stringify(this.metrics) }) } } new PerformanceTracker()
Alert Thresholds
Critical Alerts (Immediate Action Required):
- LCP > 4 seconds
- INP > 500ms
- CLS > 0.25
- Error rate > 1%
Warning Alerts (Investigation Needed):
- Performance budget exceeded by 20%
- Bounce rate increased > 10%
- Conversion rate decreased > 5%
Future-Proofing Your Performance Strategy
Emerging Metrics to Watch
Responsiveness Evolution:
- Enhanced INP measurement across browsers
- New animation smoothness metrics
- Improved mobile-specific measurements
User Experience Metrics:
- Engagement rate improvements
- Session quality scoring
- Perceived performance metrics
Technology Considerations
HTTP/3 and QUIC:
- Faster connection establishment
- Improved loss recovery
- Better mobile performance
WebAssembly (WASM):
- Near-native performance for complex operations
- Reduced JavaScript bundle sizes
- Enhanced computational capabilities
Action Plan: Getting Started Today
Week 1: Assessment and Baseline
-
Audit Current Performance
- Run Lighthouse audits on key pages
- Check Google Search Console Core Web Vitals report
- Identify worst-performing pages
-
Establish Measurement
- Implement web-vitals library
- Set up performance monitoring
- Document current metrics
Week 2-4: Quick Wins
-
Image Optimization
- Convert images to WebP/AVIF
- Implement lazy loading
- Add proper dimensions
-
JavaScript Optimization
- Remove unused code
- Implement code splitting
- Defer non-critical scripts
Month 2-3: Strategic Improvements
-
Infrastructure Upgrades
- Implement CDN
- Optimize server response times
- Enable compression
-
Advanced Optimizations
- Critical CSS inlining
- Resource prioritization
- Progressive enhancement
Ongoing: Monitor and Iterate
-
Regular Audits
- Monthly performance reviews
- Competitive benchmarking
- User feedback integration
-
Continuous Optimization
- A/B test performance improvements
- Monitor business metric correlations
- Stay updated with latest best practices
Key Takeaways for 2025
Performance is Business Critical: Every 100ms of improvement can increase conversions by 1.55%. The correlation between performance and revenue isn't theoretical - it's proven across hundreds of case studies.
Focus on What Matters: While Core Web Vitals provide important benchmarks, the metrics that truly matter are those tied to your business goals: conversion rates, engagement, and revenue.
Mobile-First Approach: With 61% of traffic coming from mobile devices, optimizing for mobile performance isn't optional - it's essential for survival.
Measurement Drives Results: You can't improve what you don't measure. Implement comprehensive performance monitoring and tie metrics to business outcomes.
Continuous Optimization: Performance optimization isn't a one-time project - it's an ongoing practice that requires constant attention and iteration.
The web performance landscape continues to evolve, but the fundamental truth remains: faster websites create better user experiences, which drive better business results. By focusing on the metrics that matter most - both for search engines and your bottom line - you can build a performance strategy that delivers measurable value in 2025 and beyond.
Related Posts
Next.js Performance Optimization: The Complete 2025 Guide
Master advanced Next.js 15+ performance techniques including React Server Components, streaming, and Core Web Vitals optimization for lightning-fast applications.

Building a Custom GraphQL API Module for Drupal 10 Article Management
Learn how to create a custom GraphQL API module for Drupal 10, focusing on article management. This guide covers the module structure, file creation, and implementation of GraphQL queries, mutations, and subscriptions.

Tutorial: Migrating a Large-Scale Legacy Drupal Site to Headless Next.js
This tutorial focuses on implementing a hybrid approach to migrate a large-scale Drupal site to a headless architecture using Next.js.